Your widgets
Instability - height Instability - background
Instability - power
Thermal flow with background.
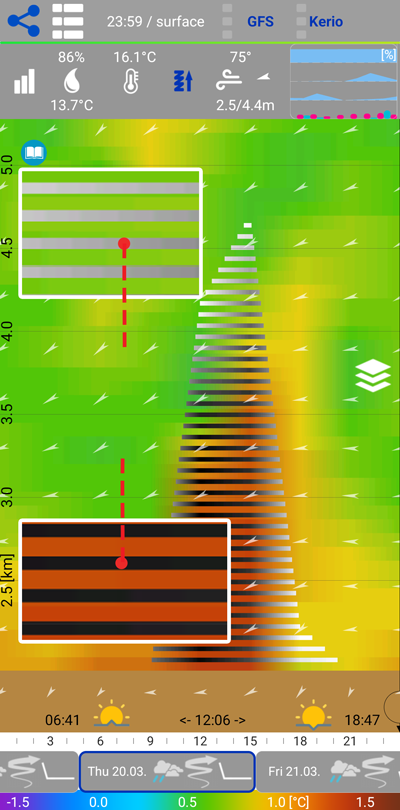
What do you see on this screen?
The horizontal bars represent atmospheric instability, i.e. the potential for thermal activity throughout the day. Darker grey to black bars indicate stronger instability – meaning a higher probability of rising air currents. Lighter bars show areas with lower instability, where the air is more stable and less favorable for thermal formation. Instability is derived from the difference between ground temperature and the temperature at altitude, normalized by the standard atmospheric lapse rate.
Different models may show different heights and intensities of instability. We recommend experimenting with individual models and observing their behavior in your local area. Over time, you may find that a specific model provides better accuracy for your location.
Simply put::
The more dark bars you see and the higher they reach, the better your chances for a longer and more enjoyable flight.