Now also free widgets
Case study: cloudless thermals with possible inversion layer
Case study: cloud thermals with the possibility of a frost peak
Case study: classic cloud thermals with morning boundary layer

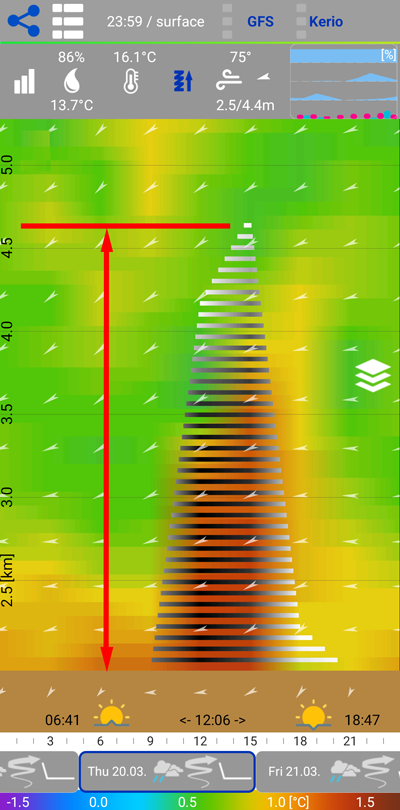
📊 What do you see on this screen?
The horizontal bars represent atmospheric instability, i.e. the potential for thermal activity throughout the day.
Darker grey to black bars indicate stronger instability – meaning a higher probability of rising air currents.
Lighter bars show areas with lower instability, where the air is more stable and less favorable for thermal formation.
Instability is derived from the difference between ground temperature and the temperature at altitude, normalized by the standard atmospheric lapse rate.
📈 Different models may show different heights and intensities of instability. We recommend experimenting with individual models and observing their behavior in your local area. Over time, you may find that a specific model provides better accuracy for your location.
💡 Simply put::
The more dark bars you see and the higher they reach, the better your chances for a longer and more enjoyable flight.

⚠️ Note:
Instability is just one of the essential conditions for active thermal development. Other important factors include:
* sufficient sunshine
* dry ground
* low or no cloud cover in middle and upper layers
* suitable wind and terrain orography.

Sometimes it happens that despite the high and strong instability, the correct updrafts do not appear or do not reach the predicted heights.
It is partially possible to clarify this by displaying a subtle temperature gradient.
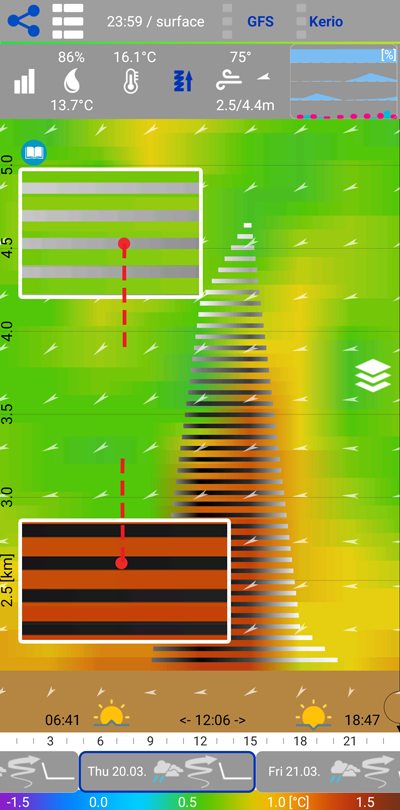
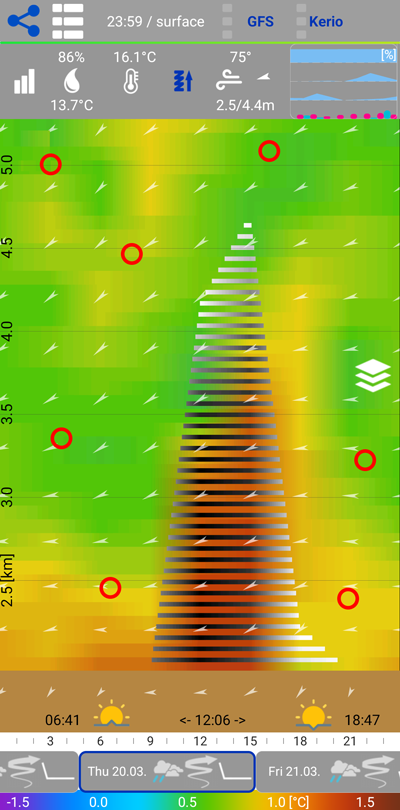
Across the entire screen and behind the horizontal instability bars, you can see a colored background that represents the temperature gradient of the atmosphere, plotted at 100 meter intervals.
At the bottom of the screen, you will find a temperature gradient scale ranging from -1.5 °C to +1.5 °C per 100 meters.
For example, at 1200m the temperature will be 12.2 degrees and at 1300 meters the temperature will be 11.2 degrees, then the temperature difference will be 1.0 degrees and the color will be yellow and the temperature gradient will support instability.
For example, at 1200m the temperature will be 12.2 degrees and at 1300 meters the temperature will be 11.9 degrees, then the temperature difference will be 0.3 degrees and the color will be blue-green and the temperature gradient will greatly worsen the instability.

🔍 How this temperature gradient affects the updrafts.
If the air passes through a temperature gradient, which is, for example, 0.4 degrees and less than 100 meters, then it can stop and spill the upward current, especially in the early hours of the morning.
The updraft can behave similarly, which is very often limited at its end of the rise.
Yellow and brown colors mean that the updraft is not limited by anything. Blue to purple colors mean that the updraft will consume energy to break through this layer.
In the morning hours, this may be an inversion, which, depending on its strength, may also influence the behavior of later thermals as well as later onset.
Summary:
When estimating instability, combine both visual layers: background gradient and instability bands, and of course other influences.

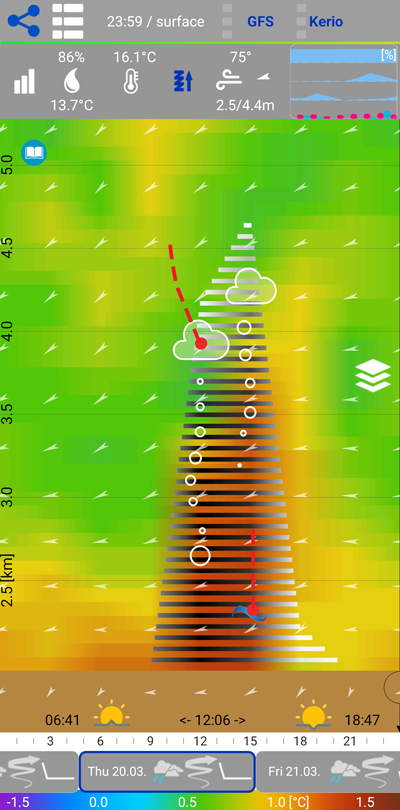
Convective cloudiness and animation of thermal bubbles.
It is displayed when there is a probability that convective thermal cloudiness will form.
The size of the cloud and the animation correspond to the lifespan estimated for the cloud and its development and disappearance. However, the user must take other influences into account. Top cloud cover, length of day, rain, etc. We adjust the algorithms based on experience and comparison with reality.
If low-level cloudiness is forecasted, then this graphic element is not displayed. You can enable or disable the animation in the settings.
The bubbles can be animated and indicate the strength and length of the upward moisture current for cloud formation.
Bumpiness of thermals.
We try to predict when the thermals will be more or less turbulent. A thermal lift where the symbol for bumpiness is drawn may indicate that part of the lift may be accompanied by uncomfortable thermals. We adjust the algorithms based on experience and comparison with reality.
Thermals are upward currents of warm air that form on the ground surface due to the uneven heating of different types of terrain, such as fields, forests, bodies of water, or artificial surfaces. For paragliders, thermals represent a key element allowing for extended flights. Thermal currents, resulting from the uneven heating of the Earth's surface by the sun, can vary in intensity and reach different heights. The strength of the thermal is determined by the rate of rising air, which can affect the climb rate of the paraglider. The height of the thermal determines how high a paraglider can ascend in the thermal, which is crucial for long-distance flights and achieving optimal routes. In strong thermals, paragliders may experience sudden ascents, but also turbulence, which requires good glider control and the ability to correctly read conditions for a safe flight.
