Your widgets
Chart 1
basic description of the graph 1
Vertical scale of height and horizontal scale of temperature
Vertical scale of height and horizontal scale of temperature
The graph shows depending on height and time:
- wind force
- direction of the wind
- the temperature
- relative humidity
- dew point
- a line of equal specific air humidity
- unsaturated adiabat
next:
- horizontal condensation level CCL
- horizontal isotherm for a temperature of 0°C
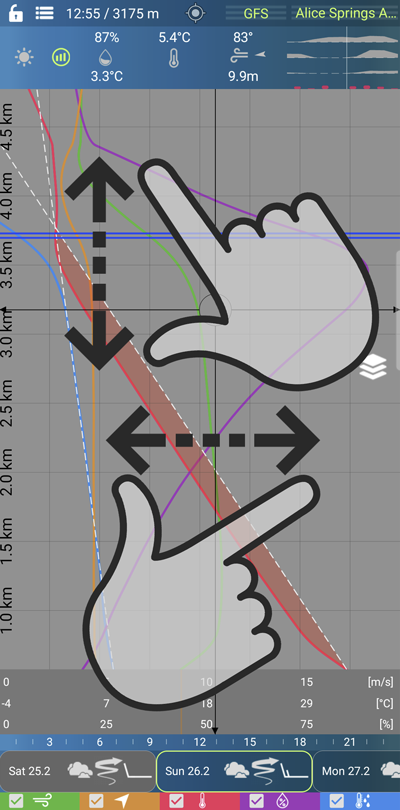
You can adjust the vertical range classically with two fingers from 1.5 km to approx. 12 km.
You can also classically use two fingers to adjust the horizontal range for temperature curves.
Individual curves can be turned on and off in the lower part.