Your widgets
Clouds
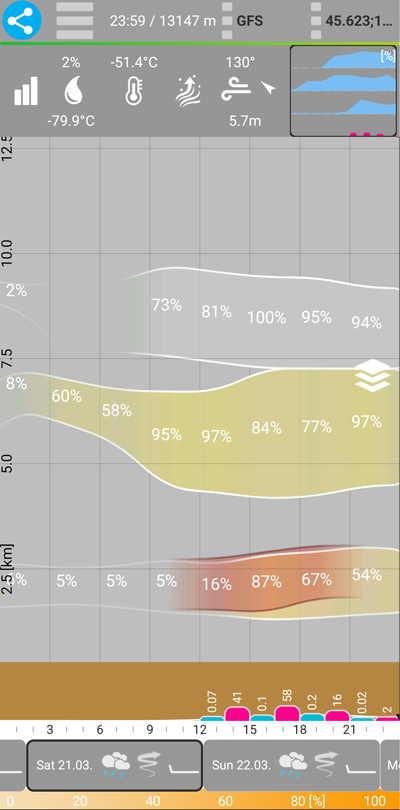
Cloud layers, convection, precipitation, and the CAPE index are shown here together with their development during the day.
simple view: cloud cover [%], precipitation, CAPE
high cloud layer: coverage [%] and thickness
middle cloud layer: coverage [%] and thickness
low cloud layer: coverage [%] and thickness
convection: height and thickness
In the top navigation overview, we can see a schematic display of the 3 cloud layers, the CAPE index, and precipitation.
On the card, we can see the 3 cloud layers, the convection layer, and how they develop throughout the day. We can see their thickness, lower and upper limits, and percentages.
At the bottom of the main screen, we can see precipitation and the CAPE index, including how they change during the day.