Now also free widgets
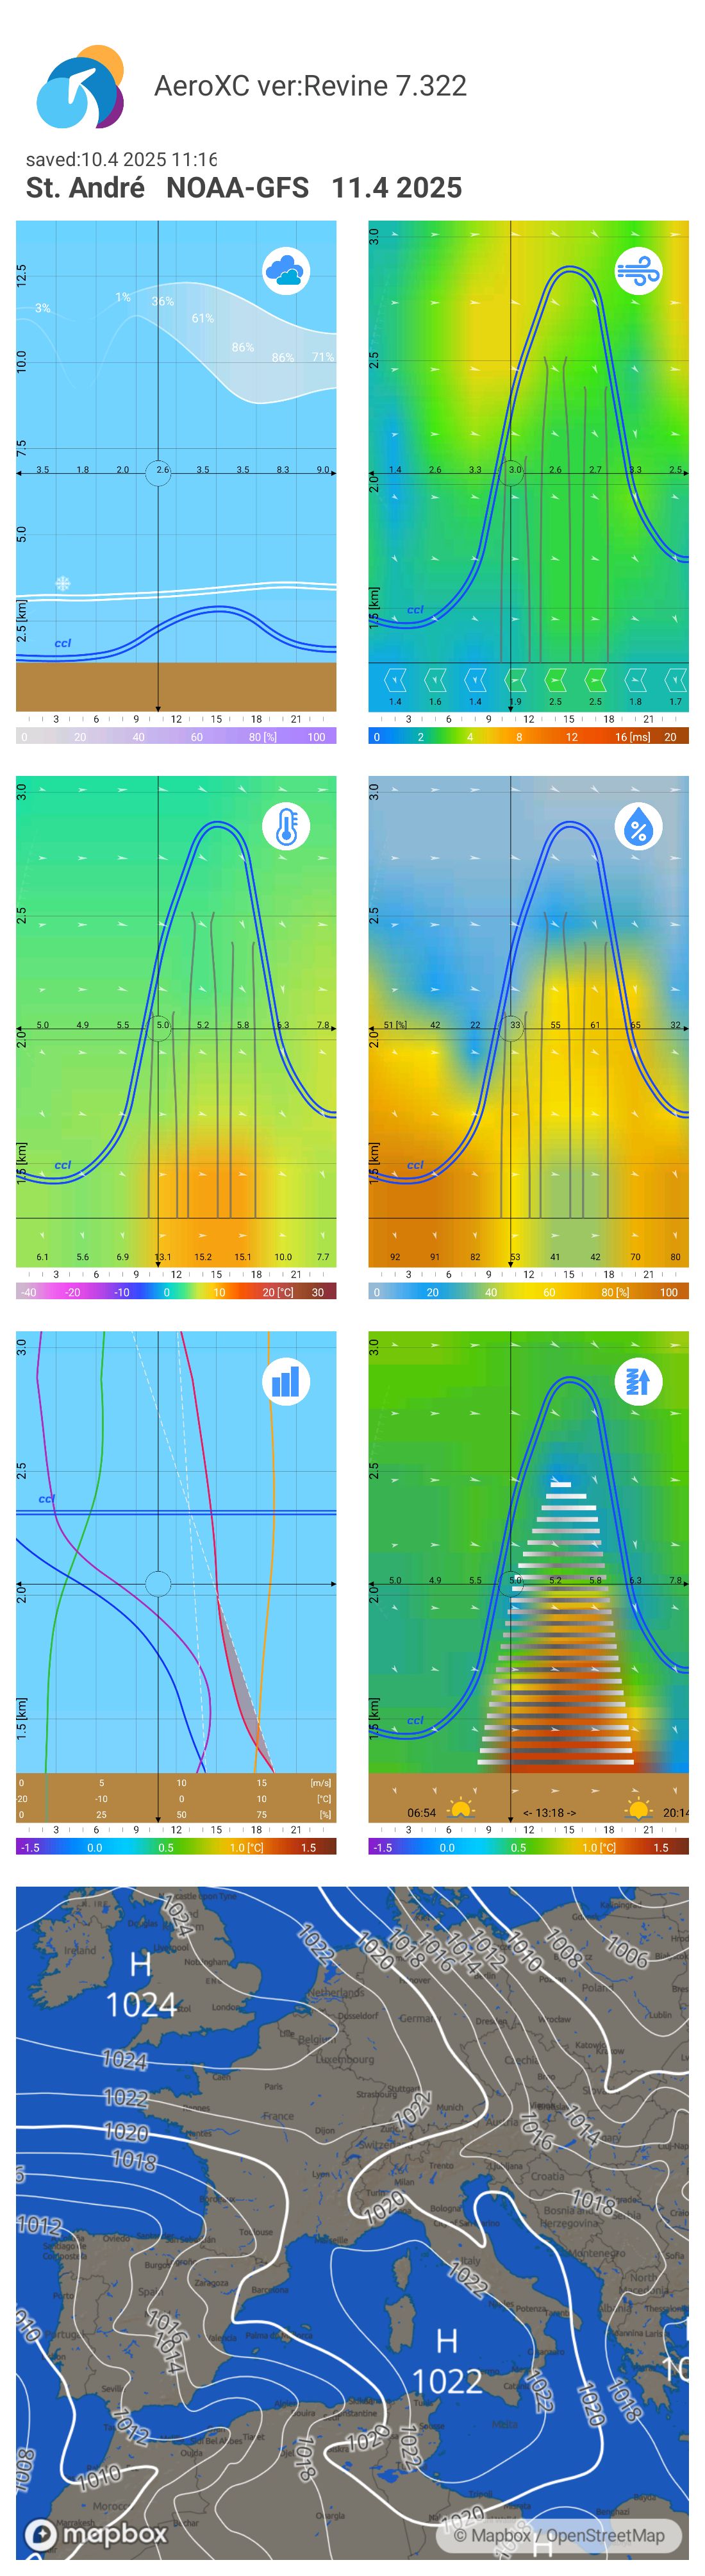
📤Forecast Sharing
Would you like to easily save a forecast for later comparison – for example, with future flights in similar conditions? Then this new feature is just for you.
Or do you just want to send a weather summary to a friend – even if they don’t use AeroXC? Now it’s even easier. Simply tap the “Share” icon, choose the forecast cards you want to include, and use the “Share” button to create a shareable image. You can then save or directly send it.
The image automatically includes the location name, forecast date, model used, and app version – there’s no need to write anything manually.
🌤️ Thermals Card
We’ve completely redesigned the thermals card. If the new version doesn’t suit you or you find the original layout clearer, you can switch back at any time in “Settings / Original Instability Display.”
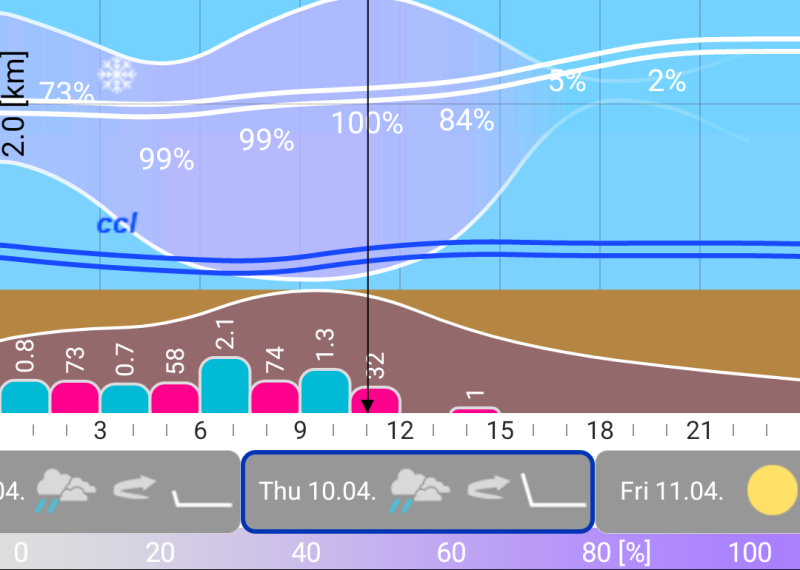
Have you ever seen a forecast with high instability, only to find your glider stopped halfway up? The answer may lie in the new design of this card – it now also shows temperature layering throughout the day.
The horizontal bars in the graph represent the level of atmospheric instability – that is, the potential for thermal activity during the day:
Darker grey to black bars indicate stronger instability, meaning a higher probability of rising air currents.
Lighter bars indicate weaker instability, where the air is more stable and less favorable for thermals.
Instability is calculated based on the difference between ground temperature and the temperature at altitude, normalized by the standard atmospheric lapse rate.
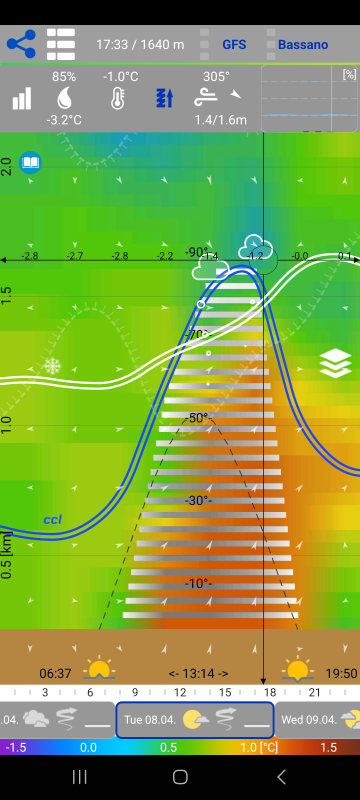
🌡️ Background Temperature Gradient
Sometimes, even when strong instability is forecast, the expected thermals don’t appear or don’t reach predicted heights. This can be partially explained by the background temperature gradient, now displayed as a subtle color overlay behind the instability bars.
The background represents the atmospheric temperature gradient and is drawn in 100-meter increments. At the bottom of the screen, a scale shows values from –1.5 °C to +1.5 °C per 100 meters.
For example:
- If the temperature is 12.2 °C at 1200 m and 11.2 °C at 1300 m, the difference is 1.0 °C, the color is yellow, and the gradient supports instability.
- If the temperature is 12.2 °C at 1200 m and 11.9 °C at 1300 m, the difference is only 0.3 °C, the color is blue-green, and the gradient significantly reduces instability.
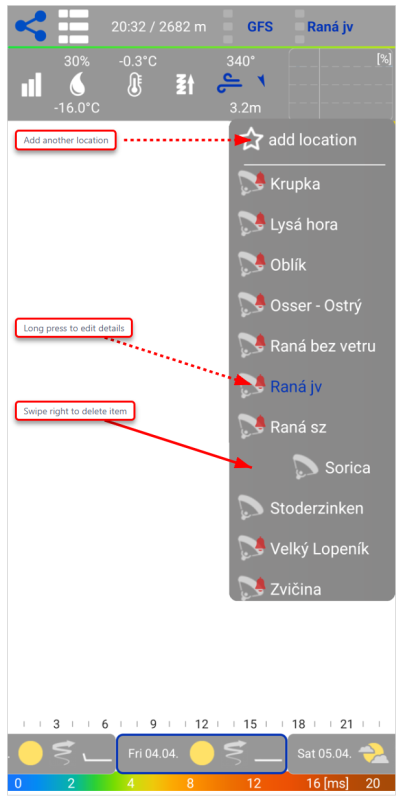
📍Location List Management
You can now add locations directly from the location list (“Add locations”). Adding from the map via long press still works, but our goal is to make the interface as simple as possible.
You can now edit a location directly in the list – just hold your finger on the location to open the detail view. To delete a location, simply swipe it to the right.
Overall, working with the location list is now faster and more intuitive.
💨Wind – Particle Animation
We’ve slightly improved the wind animation and added an option for dark particles. When zooming in on the map, precise numerical values for wind and gusts remain available.
🗃️Database Improvements
The biggest changes are under the hood – in the structure of the database that stores your local forecasts. You won’t notice a visual difference, but updates are now faster, and the new structure will allow us to adapt more flexibly in future development, including support for new models and AI-based systems.
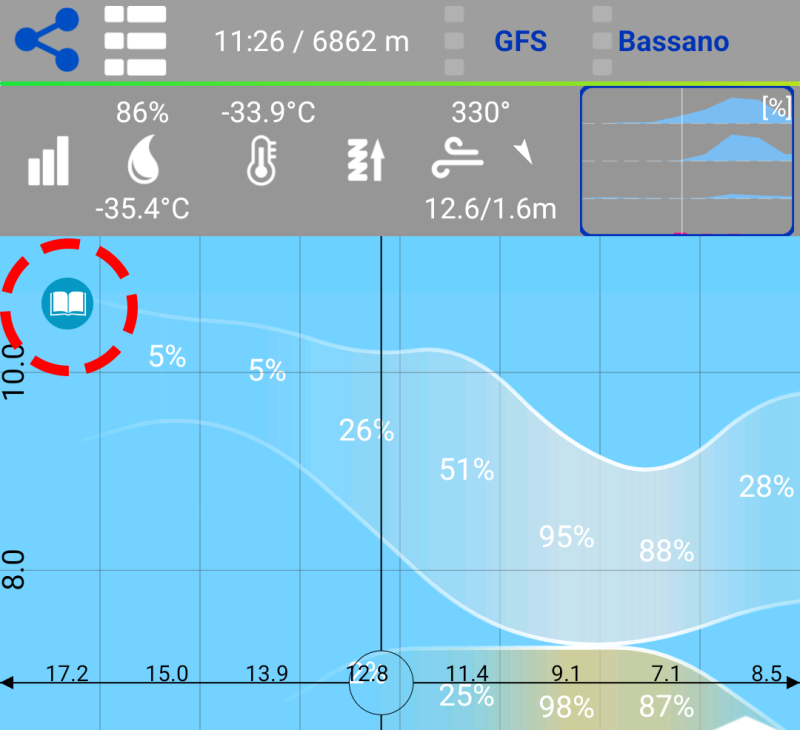
ℹ️ Interactive Manual
You can now quickly access interactive help by tapping the icon in the upper-left corner on any screen.
For example, if you're on the humidity card and tap the help icon, a page explaining that card and its data will appear.
If you're viewing the cloud and rain map, you’ll get a detailed explanation of that layer.
🌧️ Rain Summary
The cloud card now includes a rainfall summary. If it rained significantly yesterday or the day before, cumulative precipitation will be shown at the bottom of the screen as a smooth curve, similar to the CAPE index.
📱 Compatibility
We now support only Android 10 and newer. Users of older devices can still use older versions of the app, but they will no longer receive updates. This affects only a small percentage of users.
🛠️Fixes & What’s Coming
We’ve fixed several known issues and are preparing some great new features for later this year!