In the upper navigation list, we can schematically see 3 cloud layers, CAPE index and precipitation.
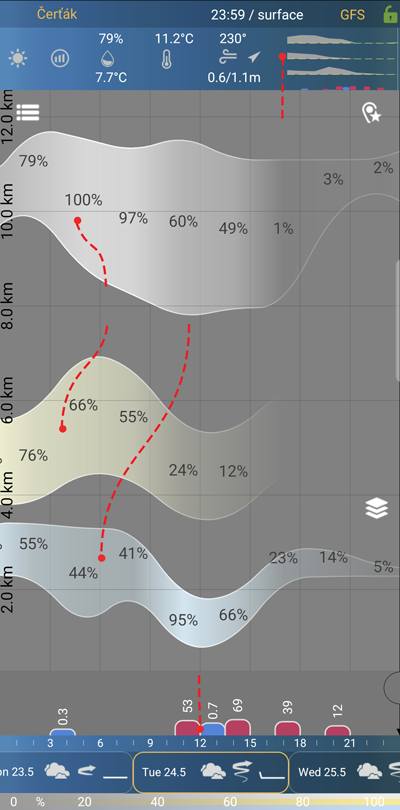
On the main screen we see 3 layers of clouds and their development during the day. We see their thickness, lower and upper limits and percentages. Everything is measured against the real values of the prediction model. The color of the clouds corresponds to the color of the clouds on the map.
This cloud screen cannot be zoomed.
In the lower part of the main screen, we can see the precipitation and the cape index and their course during the day.
simplified view of clouds, rainfall and CAPE index
all level clouds, cover and thickness
CAPE index and precipitation